Generate and open a batch file
Generate and open a batch file
To start the analysis, a batch file can be generated
The batch file contains all the information that the program needs to run (the folder where the experimental files are stored, the name of the result file, the spring constant of the cantilever, and the name of all data files which have to be analyzed). The Generate Batch File window looks like the following:

Please note that if you have calibrated the spring constant of the cantilever while performing your experiment and you want to use the value saved in the experimental data, you just need to set the spring constant value to 0.
For more details about how to generate a batch file, please refer to the corresponding section in the Help
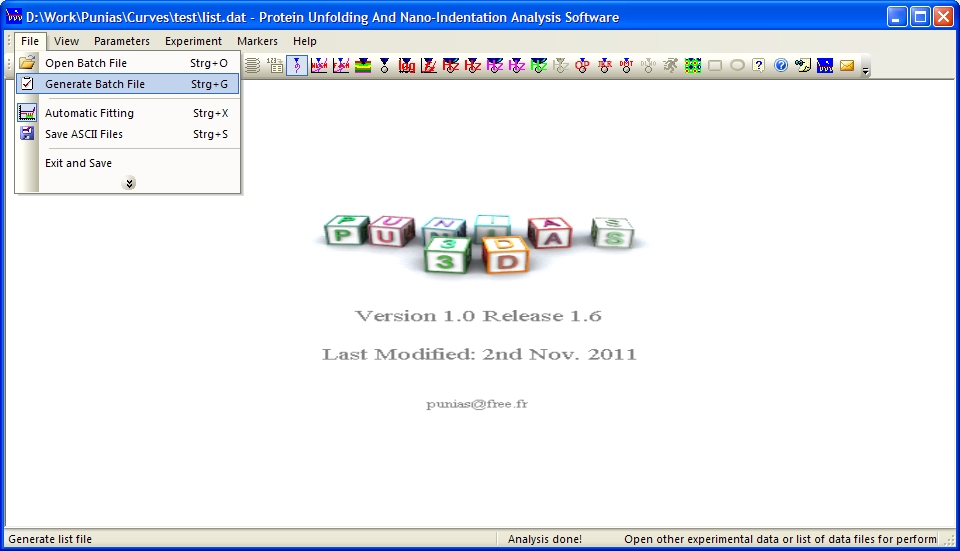
Once a batch file has been generated, you can then Open the batch file in order to start the analysis:

PUNIAS will then open (one after the other) all the curves to be analyzed. After plotting the curve, as force versus extension or deformation, the computer determines the best possible baseline for the corresponding curve, and adds it to the graph. In the same way, the unfolding peaks or markers for the different calculations are determined by an algorithm and plotted on the graph. With all of these results being plotted on the graph along with the experimental curve, the user can very quickly visualize the results the computer finds, and validate them by saving the results and moving to the next file.